
Watch the video with chapters & transcript →
AI IN FINANCE
Can Claude Dashboards Replace Power BI for Finance Reporting?
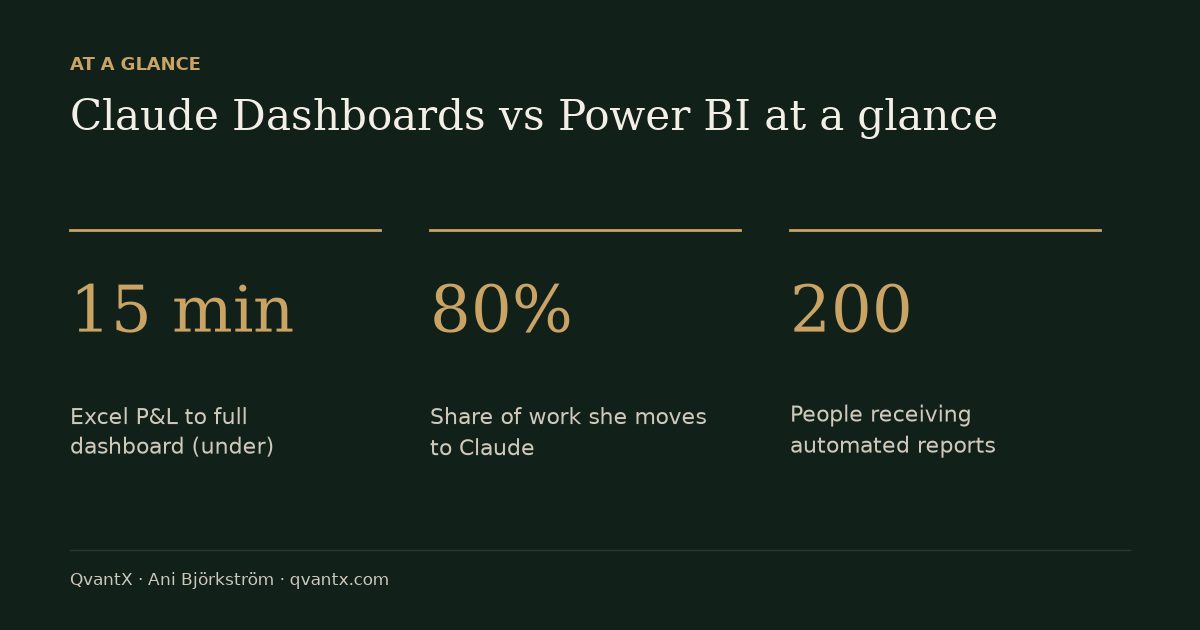
In short: For most everyday finance reporting, Claude Dashboards can replace Power BI, according to Ani Björkström, who built a full management dashboard from a raw Excel P&L in under 15 minutes. The exception is large regulated companies that need audited numbers, access controls and automated reports to 200 people, where Power BI's control layer is still needed.
Key takeaways
- For most everyday finance reporting, Ani Björkström's verdict is that you no longer need Power BI: Claude built a full management dashboard from a raw Excel P&L in under 15 minutes.
- Claude Dashboards, released by Anthropic on October 8, 2026, turns a single-sentence prompt into live, filterable charts instead of static artifacts — and works on every paid plan, including Pro.
- The one exception is the big regulated company: audited numbers, access controls (e.g. a manager in Sweden who cannot see salaries in Denmark), and automated reports to 200 people still require Power BI's control layer.
Ani Björkström, who builds data and AI systems for banks and investment companies from Stockholm, tested Anthropic's new Claude Dashboards feature on a real-world monthly finance report. In the video, she takes a realistic monthly P&L report for a fictive company, Nordica Partners (FY2026) — three revenue centers, nine months of actuals, a full-year budget, and revenue broken down by region — and turns it into a live, interactive dashboard without writing code or involving a BI team. The exercise is built for finance professionals who currently depend on a data team or Power BI specialist just to see how the business is performing.
What is Claude Dashboards and when was it released?
Claude Dashboards is a feature from Anthropic, the company behind Claude, that lets users describe a dashboard in plain language and have Claude build the charts, filters, and numbers automatically. It was released on October 8, 2026, and is currently in beta, meaning it is new and still being improved.
Unlike Claude's earlier "artifacts," which showed frozen, static data, dashboards can stay live: when connected to a data warehouse, the same link updates automatically as new numbers arrive. The feature is available on every paid Claude plan, including the standard Pro plan; enterprise customers need their account admin to switch it on first.
How do you turn an Excel finance report into a Claude dashboard?
Björkström's process took three steps: create a Claude project, upload the Excel file, and send one descriptive prompt. She first created a project called "Monthly report" in Claude Code (the web browser version works too) so she could return to update it each month or quarter, then uploaded a workbook with three tabs — P&L actuals (January–September), Budget (January–December), and Revenue by Region (Sweden, Norway, Denmark, Finland) — containing only raw revenue, COGS, personnel, marketing, IT and other operating cost figures, with no formulas or metrics — every calculation is left to Claude.
Before building anything, she asked Claude to read and describe the data back to her, to confirm it understood the three tabs correctly. She then sent this exact Claude dashboard prompt:
Now build a management dashboard from this data. I want to see:
1. Revenue against budget, per month, for each revenue center
2. Profit per revenue center — revenue minus all costs — month by month
3. Which cost lines are higher than the budget
4. Revenue by region.
Make it possible to filter by revenue center and by month.
As she points out, the only words Claude strictly needs are "build a dashboard"; the numbered list simply tells it which views management wants. Claude organized the build steps in a progress panel and produced the full interactive dashboard in under 15 minutes.
Can you trust the numbers and share a Claude dashboard with colleagues?
Yes — every chart can be traced back to its source formula, and the dashboard can be shared via a private link or direct email invite. Double-clicking any chart reveals an "Ask Claude" button and a "Source" button; the Source button shows exactly which formula and underlying data produced that number, so a finance reviewer can verify reliability before presenting the figures.
The "Ask Claude" option opens a chat where users can ask questions about the numbers or request changes, such as switching a bar chart to a pie chart or changing the color scheme, with no technical team involved. Sharing works through a "Share" button that offers a copy-private-link option, which opens the live dashboard in any browser.
Is Power BI dead now that Claude Dashboards exists?
Björkström's direct answer is that for most reports in most companies, Power BI is no longer necessary — but one exception remains. She argues that Power BI's real costs — a specialist to build every report, training to use it, per-user licenses, and days or weeks of waiting — are now harder to justify when Claude can connect directly to the same data warehouses, including Snowflake, BigQuery, Redshift, and Databricks, and build a live dashboard from one sentence.
The exception is the large regulated company: official numbers signed off by auditors, access rules such as a Swedish manager being blocked from seeing Danish salary data, and reports automatically distributed to 200 people every Monday. Because Claude Dashboards is only about one week old and still in beta, it does not yet replace that control layer. Her recommendation: small and mid-size companies have little reason to start a new Power BI project for normal reporting, while big regulated firms should keep Power BI for official audited reports and move everyday reporting — which she estimates is 80% of the work — to Claude.
| Step | Action | Result |
|---|---|---|
| 1. Setup | Create a Claude project ("Monthly report") and upload the Excel file with P&L actuals, Budget, and Revenue by Region tabs | Claude reads and describes the three tabs back before building anything |
| 2. Prompt | Send the four-part dashboard prompt covering revenue vs. budget, profit by revenue center, over-budget cost lines, and revenue by region, with filters | Full interactive dashboard built in under 15 minutes |
| 3. Verify | Double-click any chart and select "Source" | Shows the exact formula and data origin behind each number |
| 4. Share | Click "Share" and copy the private link, or invite colleagues by email | Live dashboard opens in any browser and updates when data changes |
| 5. Scale | Connect Claude to a data warehouse (Snowflake, BigQuery, Redshift, or Databricks) instead of Excel | Dashboard refreshes automatically as new data lands |
FAQ
Which Claude plans include Dashboards?
Claude Dashboards is in beta and works on every paid Claude plan, including the standard Pro plan. On an Enterprise plan, the account admin has to switch the feature on first.
Claude Dashboards vs Power BI: do I still need Power BI?
For most everyday reporting in most companies, Ani Björkström says no. She recommends keeping Power BI only for the control layer of large regulated companies: official audited numbers, row-level access rules and scheduled distribution to large audiences.
Which data sources can a Claude dashboard connect to?
Besides uploaded Excel files, Claude can connect straight to data warehouses such as Snowflake, BigQuery, Redshift and Databricks — the same tables Power BI reads — so the dashboard updates itself when new data arrives.
How is a Claude dashboard different from a Claude artifact?
Artifacts are frozen and show static data at the moment they were created. Dashboards can stay live — when connected to a data warehouse such as Snowflake, the same dashboard link automatically refreshes with new numbers.
Is it safe to upload real company financial data to Claude?
Ani Björkström used only fictitious data in her demonstration and explicitly warns that real company numbers are confidential — she advises checking your company's rules before uploading real data to any AI tool.
Read the full video transcript, with chapters, on the video page →
Want this working inside your finance team?

Ani Björkström — founder of QvantX Sweden AB, a Stockholm consultancy building AI solutions for banks, asset managers and finance teams. Anthropic partner. Every article starts from a real client build, minus the confidential parts. LinkedIn →
Keep reading — AI in Finance
 AI Stocks Just Lost $2.8 Trillion. Is the AI Bubble Popping?
 Anthropic IPO & Stock: Is It Really Worth $2 Trillion?
 AI's Circular Financing, Explained — Scam or Not?
 I Tested Claude for Excel: It Fixed My Broken P&L Model
More: all 64 articles · AI's Circular Financing, Explained — Scam or Not? · I Tested Claude for Excel: It Fixed My Broken P&L Model · 3 Claude Agents Every Finance Analyst Should Steal (Full Prompts Included) · 3 Ways to Use AI for Finance & Asset Management · work with QvantX