I Tested Claude for Excel: It Fixed My Broken P&L Model
AI IN FINANCE
Can Claude for Excel Fix a Broken P&L and Catch a Budget Breach?
In short: Claude for Excel flagged a travel-and-expense breach of 40.5% against an 8% policy limit — a SEK 42,000 overspend — and named the department driving it, in under a minute.
Key takeaways
- Claude for Excel flagged a travel-and-expense breach of 40.5% against an 8% policy limit — a SEK 42,000 overspend — and named the department driving it, in under a minute.
- On a P&L tab with three broken formulas, Claude diagnosed two divide-by-zero errors and one caused by a deleted reference column, then repaired all three on request.
- Given 34 months of cash history, Claude built a full 2026 monthly revenue-and-cash forecast with adjustable growth and seasonality assumptions, including a manual flag for July as a Nordic factory-shutdown month.
In a hands-on tutorial, Ani Björkström, a Stockholm-based tech consultant who works with asset management and private equity firms, tests Claude for Excel against seven finance tasks that typically eat up a controller's or analyst's week. The workbook belongs to a fictive company, Northcomp AB — a mid-size Nordic distributor with 240 employees and SEK 310 million in annual revenue, operating across Sweden, Norway, Denmark and Finland. The data is synthetic, but the tasks — policy compliance, broken formulas, legacy models, messy GL exports, forecasting, valuation and board reporting — are drawn directly from day-to-day finance work.
How does Claude catch a policy breach inside a live spreadsheet?
Claude for Excel is opened from the Start ribbon and requires at least a Claude Pro account. Once active, it reads the formulas and data on whichever tab is currently open — so the video stresses staying on the correct tab before prompting. The first test asks Claude to check whether combined travel, hotel and meal spend stays under an 8% policy cap and to identify the biggest driver. Claude adds a policy-compliance breakdown directly into the sheet: total T&E spend of 58,155 against total operating costs works out to roughly 40% of the total — five times the limit — and it lists the spend by department (sales, management, operations, finance), pointing straight to where costs need to be reined in.
Can it actually repair a broken P&L, not just describe the problem?
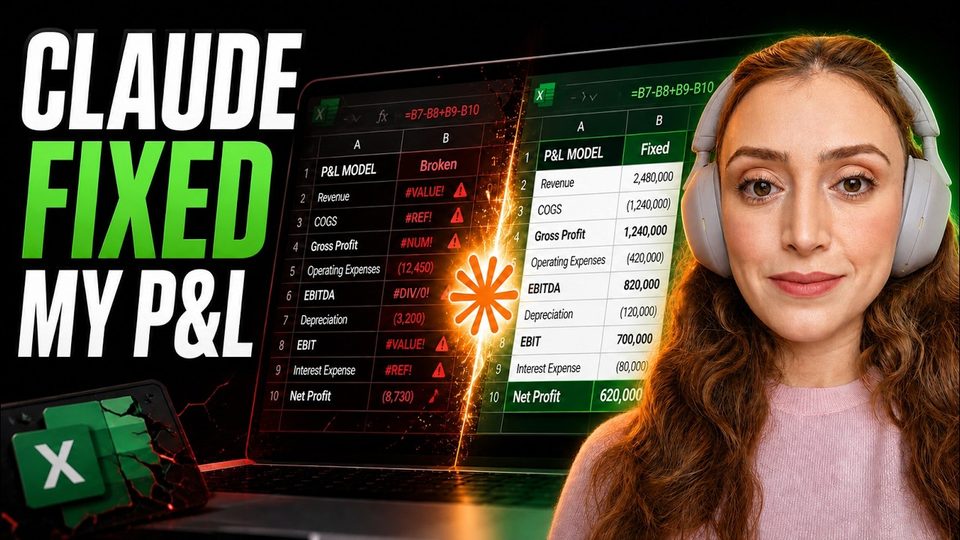
On the P&L tab, three cells return errors — a recurring monthly headache for any finance team. Asked to find every broken cell and explain the cause, Claude identifies two divide-by-zero errors and a third caused by a missing reference column, then explains what to fix. Björkström fixes the first two manually to preserve understanding of the change, then asks Claude to fix the remainder directly — a shortcut recommended only outside production environments, with manual verification afterward non-negotiable.
What about legacy formulas and messy GL data nobody wants to touch?
A "legacy allocation" tab, built by a departed colleague and left untouched out of caution, allocates HR and facility costs across the four Nordic countries. Asked to explain the column E formula step by step and judge whether the logic holds up, Claude confirms the allocation logic is sound and walks through the calculation. Separately, a raw general-ledger export — with inconsistent department naming, negative amounts stored as text in parentheses, and likely duplicates — gets a full cleanup: Claude standardizes dates and department names, fixes the amount formatting, removes exact duplicates, and builds a GL Clean sheet plus a GL Summary sheet by month and account, leaving the raw export untouched as a source record.
| Task | Prompt focus | Result |
|---|---|---|
| T&E policy check | 8% cap on travel, hotel, meals | 40% of total cost, SEK 42,000 over budget, by department |
| P&L repair | Find and fix broken cells | 3 errors diagnosed (2x div/0, 1 missing reference) and corrected |
| Legacy allocation | Explain formula, judge soundness | Logic confirmed sound, step-by-step walkthrough produced |
| GL export cleanup | Standardize dates, names, amounts; dedupe | New GL Clean and GL Summary sheets, source data preserved |
| 2026 forecast & DCF | Monthly forecast, seasonality, valuation, chart | Assumptions, Forecast and DCF sheets plus a revenue chart by region |
Is it ready for a CFO forecast or a board-ready DCF?
Using 34 months of cash history, Björkström asks Claude to build a monthly 2026 revenue-and-cash forecast, placing growth and seasonality assumptions on a separate, editable Assumptions sheet — noting that July is a factory-shutdown month in the Nordics, a detail Claude would not know without domain input. Claude returns an Assumptions sheet with adjustable inputs and a seasonality table, plus a live Forecast sheet. From there, it builds an indicative DCF valuation using the same historical financials and assumptions, and finally generates a bar chart of revenue by region on the Revenue tab, ready to be copied into a board presentation.
FAQ
How do you access Claude inside Excel?
It launches from the Start ribbon, requires signing in, and needs at least a Claude Pro account; once open, it reads the tabs and formulas of the currently active sheet.
Was the financial data in the demo real?
No — Northcomp AB is a fictive mid-size Nordic distributor created for the tutorial, with synthetic figures, not client data.
Should you let Claude edit a live model without review?
No. The video recommends using "ask before edit" rather than "accept all edits" in production, working from a copy of the workbook, and always reading Claude's reasoning and verifying outputs before presenting them to decision-makers.
Full transcript of the video (2,776 words, 20 sections)
Chapters: 0:00 What Claude can build in Excel · 0:10 Meet Ani and the finance workbook · 0:51 Find a 40.5% policy breach · 3:55 Diagnose and repair a broken P&L · 5:59 Explain legacy Excel formulas · 7:25 Clean general-ledger data · 10:46 Build an adjustable finance forecast · 13:57 Create and review a DCF valuation · 15:02 Generate a board-ready revenue chart
0:09 Hi guys, my name is Annie. I'm a tech consultant based in Stockholm. I work for asset management and private equity companies and I spend a lot of time with finance people. I see people spending half of their days in Excel sheets. That is why in this tutorial, I will show you how to use Cloud in Excel to automate most common cases for finance being excels. Let's get started. For this tutorial, I created a worksheet that is very close to an actual worksheet. However, the data is synthetic data and is not taken from any client. So here we will work with a company called Northcomp AB. This is a fictive company. It is mid-size Nordic distributor. It has 240 employees and it has 310 million annual revenue.
0:55 It is based in Sweden, Norway, Denmark, and Finland and we will take the role of finance manager. So first we will look into T&E tab. Here we can see all the travel related expenses and in the company, we have a policy that all of those expenses need to be 8% of total operational expenses. If I didn't use Cloud, I would then create a helper row with some if function. However, let's try to use Cloud and see how quick the same job can be done. In order to use Cloud in Excel, we will click on start and then Cloud will pop up in here. Let's click on the Cloud. You can see that we need to log in for the first time and we need to have at least pro account in Cloud in order to use Cloud in Excel.
1:44 Now you can see that a chat pops up in here and we can start to ask questions. So one thing to remember is that Cloud in this chat has access to all the tabs that we have in our worksheet and also it has access to all the formulas. So if we go to the read me tab here we have our first prompt that we want to ask and it says our policy says travel hotel and meal together must stay under 8% of total cost on this sheet. Are we compliant? Which department is the biggest driver? So we will just copy this prompt that I prepared and we will go to the tab. It is very important to go [clears throat] to the right tab. Cloud tab is referencing the current tab and we are referencing current tab in our prompt. And now we will click on enter button and cloud will start to read the data on this tab and then do the analysis.
2:34 Here we can see the thinking process. We have an answer. It took cloud less than a minute to provide this answer. We can see that cloud added new information in the same tab. Now we are looking into T&E policy compliance check. We have policy limit percentage of total cost on sheet and this is equal to 8 as we said in our read me section. I will try to minimize this so we can read the information easily. So here you can see that we have the policy limit percentage of total cost on then we have total cost on this sheet which is then coming from the same sheet. Here is the number and then underneath that we have T&E spend travel hotel meals. So this is combination of all those values in this Excel tab which is 58,155 and then calculated T&E as percentage of total.
3:27 So we have 40% instead of 8%. We basically spend around 42,000 over the budget. And is it compliant? The answer is no. And then underneath that we have this cost spent by department. We can see how much sales, management, operations and finance department used. We can then go back to different departments and try to see how they need to minimize their trap. Now, let's go to next use case. In the next step, we will look into monthly P&L on the people that work with accounting or finance, they know exactly what P&L is and they will definitely know which type of issues comes up in P&L every single month. So, right now if we go to our P&L sheet, we can see that we have some formulas that are not working and we need to try to resolve those formulas and this is a repetitive work because we will work with P&L every single month.
4:20 If we go to read me, here is the prompt that I prepared which says, "There are errors in P&L. Find every broken cell. Explain what causes each one and tell me exactly what to fix." Let's copy this text and go back to P&L tab. And here we will pass the next prompt that says, "There are errors in P&L. Find every broken cell. Explain what causes each one and tell me exactly what to fix." So, now it will start to look into this tab and try to understand why we have those three errors and it will try to help us to fix those issues. Here we have an answer and answer is that those two formulas aren't working because those are divided to zero which you can't do in mathematics. And then when it comes to this one, Claude basically says that the reason that this doesn't work is because the reference column is taken away.
5:12 So, here we can read all the information a lot more carefully in real life situation and then we can either ask Claude how should we fix this and we can fix it on our own so we understand what exactly was changed and this is how I would recommend you to do in real life situation that you understand what needs to be changed and change it on your own or you can even ask Claude to fix it. In this case, you can ask Claude to fix it because this is not an actual production environment. Please fix all the errors. Great. As you can see, Claude fixed the issues, and I will strongly recommend to verify afterwards that everything looks great. Now, next go to the next step. In the next step, we will look into legacy allocation.
5:57 So, we have one tab in here that is called legacy allocation. This one was built by one colleague that left a couple of years ago, and he even said that we shouldn't touch the formulas. However, because we inherited this Excel worksheet, we need to understand the formulas. And if we click under allocated cost here for per department, we can see that those are big formulas. In general, this worksheet is showing us how much money is allocated per department in Sweden, Norway, Denmark, and Finland. And we can see that HR and facility departments are sharing their costs across the countries. And just for this example, we need to understand those formulas because those are the big formulas. And if we aren't an Excel pro, then we might not understand what exactly the formula does.
6:43 That is why let's go to our read me section. Let's try to copy the prompt that I prepared for this example, and we will paste the prompt in the chat once we go to the correct tab. That is very important to go to the correct tab because chat is referencing the tab that is opened while we are talking to the chat. So, here we say, "The person who built this allocation left the company. Explain how the formula in column E works step by step and whether the allocation logic is sound." But we have an answer. It took less than a minute, and Cloud explains that the logic is sound and also explains all the formulas and the numbers are Now, let's go to the next demo. In the next step, we will look into raw GL exports from ERP system.
7:31 This is our prompt. Let's copy the prompt, and then let's go and look into our GL export. So, what is happening in here is that we exported GL account data from our ERP system. So, you can see the balance for each account department are not consistent. We have, for example, finance all capital letters, then we have finance that is shortcut, and we have finance that only the first letter is capital. Then, apart from that, when we look into amounts, you can see that all the minus amounts are in the braces, which is not optimal because we can't use this format So, when we do calculations in Excel. So, we need to do a real clean up in here, and it can be even so that we have duplicates.
8:16 If we do this one by one, row by row, this can easily take a day or half a day. So, let's try to use Cloud first to clean up this data and then to run some formulas on it. We will say clean the GL export, standardize all booking dates to this specific format, and then we will say fix amounts stored as text and negative in parentheses, standardize department names, remove exact duplicates, then create a summary sheet of spend by month and account. So, again, this is something that you will probably do every single month, and it will take a day or two. And now, let's try to delegate this job to Cloud, use the advantage of living in AI era, and see how quick the same job can be done.
9:05 And do not understand me wrong, my philosophy is delegate the job to Cloud. However, follow all the job that Cloud is doing. Try to understand how it is thinking, and make sure that you understand both the process and also verify the results. Cloud created five different steps that it will run. First, it will create sheets. Next, it will build date format and department mapping tables. After that, it will build clean GL rows with all the formulas. Next, it will build spend by month and account summary and after that it will build verify parsing photos and duplicate removal. Now we can just lean back, try to relax and during this process we can follow what cloud is doing because one thing that is great about cloud it is that it is writing down everything it does.
9:53 We have an answer is new sheets were created and I left raw GL export untouched as the source of the records. Great, let's go to the first sheet that is called GL clean. Here you can see that for booking date it has the source, it has the detected format that we asked for. Then we have month, we have account, we have department. Here as well we have the raw department, then we have the fixed department. And then we have text, amounts. So, this tab looks fine. In production you can read in detail and understand and verify that everything looks good. Next we will go to GL summary. This is the summary that we ask cloud to create and in here we can see that it's summarized accounts. We have just one row per account that we have the total for that account.
10:39 Amazing. Now let's go to the next user case which is cash history. We have one tab where we have all the cash history. If we go to in read me here we see that we have 34 months of revenue and cash and CFO wants a 2026 forecast. This is another very common user case that happens if you are a financial analyst, controller, accountant, or financial manager. So, let's go through cash history and instead of doing this work on our own as you used to do and spend a couple of days on this, let's ask cloud to do the job. So, we will ask based on cash history build a monthly 2026 revenue and cash forecast on the forecast sheet.
11:24 Put the growth and seasonality assumptions on the assumptions sheet so I can adjust them. Note that July is a factory shutdown month. So, here it is very important to remember that in Nordic countries, July is normally the holiday month, which means that we don't have a lot of cash flows coming in in July. Uh that is one thing that we can put on our assumption tab before we create the forecast. Now, we can see that Cloud is deciding on how to clean the seasonality factor. And the same thing in here, we will read all the process, try to understand what Cloud is doing, and if there is something that you know better because you as a person with domain knowledge will know some specifics better than Cloud, you can always instruct Cloud.
12:11 So, do not take the response or the answer that Cloud is giving without checking. think with Cloud, use Cloud as a thinking partner, and instruct Cloud when there is the need. Uh you can see that when it comes to permissions, I'm using accept all edit. However, [clears throat] in production environment, I will recommend that you use ask before edit. So, you follow the process, and you directly review every single edit before it is done to your worksheet. And also, for safety reason, if you just have one worksheet, and if it is saved locally in your computer, then I will recommend to do a copy of that worksheet and work in the copy. If something was updated at Cloud that you didn't want to update, you always have the source saved somewhere.
13:00 So, now we have a result. Cloud says built and verified two sheets, all live formulas. So, we have the assumption sheet that we asked for. Here, we have all the assumptions, and then we have our input on the same assumption folder that you can change. It is between B15 and B18. So, those ones are our input that we can easily change, and the numbers will change if we do this as well. And then, we also have seasonality that is between B4 and G15. So, this is the seasonality table. And then we have a separate sheet for forecast. So, it was created in here. If we scroll, we can see all the forecasts. And this is something that will normally take us couple of days to create.
13:45 And one job that is remaining is reading through all the work process and trying to understand all the numbers. Okay, let's go to the next demo. So, for the next demo, we will see that board ask us for an indicative DCF valuation. So, this is another task that will normally take us a lot of time to do. So, let's try to delegate this to cloud. We will copy the prompt and we will go to the right tab that is this one. So, here you can see that we have all the numbers for 5 years. However, board want us to create an individual DCF on separate DCF So, we will send this prompt to cloud. Then we will give some time to cloud to create DCF model based on historical financials and assumptions that we created in the previous step.
14:38 Great, we have a result. It says built on DCF and all drivers are on assumptions. Let's go to DCF and see. Here we have our default cash flow model that we can present for the board. Amazing. Again, what you will do at this stage, you will read the thinking process how cloud actually calculated all of those numbers and you will verify before showing this to board. And in the next And in the next step, we will ask cloud to create a bar chart of revenue by region. So, as you know, most of the times when you are doing your presentations for the board, you will not show the worksheet. Instead, you will need to create some type of presentation and get some numbers and visuals from your worksheet. So, let's try to ask cloud to create those visuals for us and see how successful Cloud is. We have a response and let's try to go and check how the revenue mix looks.
15:29 There we have a response. Let's go and check how the revenue tab looks and this is it. We even have all the visualizations, so we can just copy this visualization from our Excel worksheet and present in our presentation. So, those were all the
Want this working inside your finance team?

Ani Björkström — founder of QvantX Sweden AB, a Stockholm consultancy building AI solutions for banks, asset managers and finance teams. Anthropic partner. Every article starts from a real client build, minus the confidential parts. LinkedIn →
Keep reading — AI in Finance
 AI's Circular Financing, Explained — Scam or Not?
 3 Claude Agents Every Finance Analyst Should Steal (Full Prompts Included)
 3 Ways to Use AI for Finance & Asset Management
More: all 54 articles · Claude vs ChatGPT for finance · best AI tools for finance teams · work with QvantX