NVIDIA's True Value According to Claude AI (Spoiler: It's Wrong)
AI IN FINANCE
Can Claude AI in Excel Build a Real DCF Model? A Live Nvidia Test
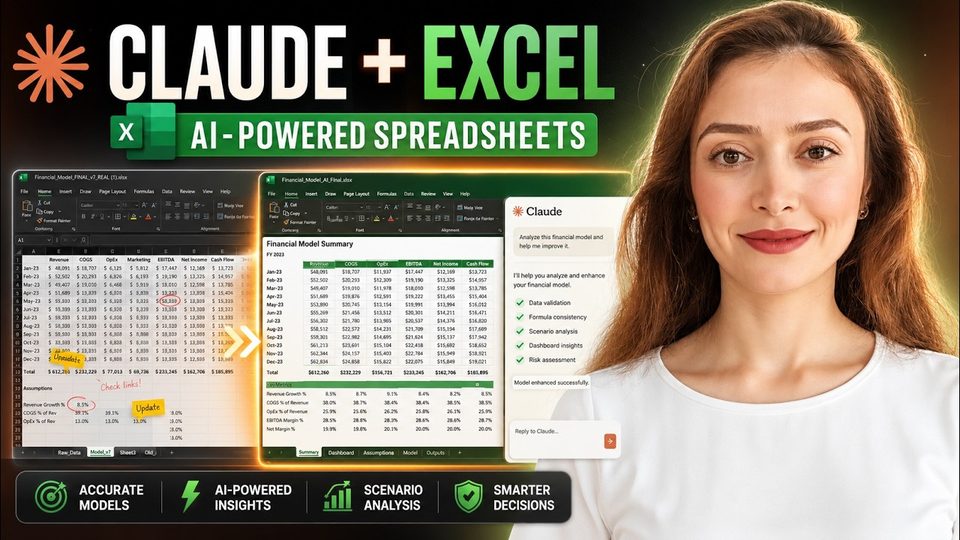
In short: Claude for Excel built a 5-year DCF model for Nvidia directly inside the workbook, using live formulas linked to the historicals tab and no hardcoded numbers.
Key takeaways
- Claude for Excel built a 5-year DCF model for Nvidia directly inside the workbook, using live formulas linked to the historicals tab and no hardcoded numbers.
- Claude's first draft used a 3% terminal growth rate; correcting it to 2.5%, in line with long-run GDP growth, changed the implied value per share.
- Claude completed roughly 90% of a junior analyst's modeling work, but it still lacked the number sensitivity to judge which assumptions are too aggressive.
Anthropic's Claude for Excel sits inside your own workbook, reads the data on every tab, and writes formulas for you. To test it on realistic work, Ani Björkström, a tech consultant in the Stockholm financial industry, rebuilt the kind of DCF model junior analysts produce at large financial institutions, using Nvidia's public financials as the only input.
What data does Claude for Excel need to start a DCF model?
Claude only needs one tab of historical financials; every other tab can start empty. Because Nvidia is publicly traded, its income statement, balance sheet, and cash flow statement are freely available online and can be copied into a historicals tab, with all values in US$ millions.
In the test, the DCF, assumptions, and earnings tabs were cleaned of all numbers first, so every formula in the finished model was demonstrably generated by Claude.
How do you prompt Claude to build the model?
The first prompt primes the model with a role: "You are a senior equity research analyst working directly inside this Excel workbook," followed by instructions to build a 5-year DCF on the DCF tab, taper Nvidia's growth down each year, and use live formulas with no hardcoded numbers. Crucially, the prompt asks Claude to confirm its understanding and present a plan before touching any cells.
Claude responded with a plan referencing both tabs, noting that Nvidia's growth rate was 65% in the last year while projecting lower growth forward. After a simple "yes, go with it," Claude produced the full model: unlevered free cash flows, valuation, and an implied value per share.
Where did Claude get the assumptions wrong?
Claude initially set the terminal growth rate at 3%, above the roughly 2.5% long-run GDP growth a careful analyst would use as a ceiling. A follow-up prompt challenged the assumptions tab as "too aggressive or unsupported," told Claude to change terminal growth to 2.5%, and asked for the new implied value per share, which Claude recalculated and explained.
| Model input | Claude's first pass | After the analyst's challenge |
|---|---|---|
| Terminal growth rate | Claude proposed 3% terminal growth | Corrected to 2.5%, aligned with long-run GDP growth |
| Revenue growth | 65% growth in Nvidia's last historical year | Growth tapered down in each projection year |
| Share price check | Implied value per share from fundamentals | Compared against Nvidia's market price of 194 |
Comparing implied value per share with Nvidia's actual market price of 194 turned the exercise into a real valuation question: is the stock overvalued? Claude added the current share price to the assumptions tab and flagged the relevant cells in red and yellow.
Can Claude in Excel replace a junior financial analyst?
The answer is yes and no: Claude did about 90% of the job, but not the judgment. It built the DCF, generated assumptions, and wrote the difficult formulas, yet it needed an experienced analyst to spot that 3% terminal growth exceeds long-run GDP growth. Claude can do the math; the analyst supplies context and skepticism.
FAQ
Does Claude for Excel hardcode numbers into the model?
No, when prompted correctly it uses live formulas linked to the historicals tab, so a changed input flows through the entire DCF.
Should you accept Claude's assumptions as given?
No. Claude proposed 3% terminal growth, above long-run GDP growth of about 2.5%, and only corrected it when challenged in a follow-up prompt.
Full transcript of the video (1,205 words, 9 sections)
Chapters: 0:00 Is NVIDIA overvalued? (the $104.69 question) · 0:20 Claude now lives inside Excel · 0:40 The data: NVIDIA's financials · 1:40 Priming Claude + building the DCF · 3:30 The valuation reveal · 4:05 Market price vs fair value · 4:45 The all-red sensitivity check · 5:40 The mistake the AI made · 6:20 Verdict: 46% overvalued · 6:40 Recap + free prompts
0:02 This is exactly the same type of model that junior financial analyst are creating in big financial institutions. Let's try to create exactly the same model using Cloud's new financial agents. For the context, Anthropic launched Cloud that is sitting in your own Excel sheet. It has access to all the data in your Excel and can create formulas for you. If we haven't met, my name is Annie Bjorkstrom. I'm a tech consultant working in financial industry in Stockholm. Now, let's get started. This is my Excel sheet and here on the first tab under historicals, I have all the historical information about Nvidia. Nvidia is publicly traded company, which means that all the financial statement can be income statement, balance sheet, cash flow is accessible publicly and you can just come to this website and copy this information.
0:55 If you I go back to my Excel sheet, here all the numbers that are under historicals will be used to calculate DCF or default cash flows. We can go to the second tab and let's clean all this information because I want to showcase in real time how Cloud can create this data. Next, let's go to assumptions. Here we also have some data and let's try to clean all of this as well and then under earnings we have nothing. Now our Excel sheet is totally free of numbers. The only thing that we have are historicals that will be used to create the model. If you click on start, you can see Cloud icon in here. Let's click on this and let's prime the model, which means that we are saying to Cloud who it needs to be and what it needs to do.
1:43 Let's try to copy paste the first prompt. Do not worry about the prompts. I will be sharing all the prompts with you. And now this is the actual prompt. You are a senior equity research analyst working directly inside this Excel workbook. On the historical tab, I have past Nvidia's financials, all values in US millions. Build 5-year DCF on the DCF tab. Project revenue forward, but taper Nvidia's growth down each year. Use live formulas linked to historicals, no hardcoded numbers. Confirm you understand the workbook. Now, we click on enter button. And the assumption is that at this point, it will read all the historical numbers and it will come with a plan. It is not building or putting any formulas or numbers in this Excel sheet at the moment.
2:34 Instead, it will create a plan because we asked it to create a plan, to present the plan for us, and then after that, we will define if we want to go with the plan or not. Here comes an answer. It says, "I have reviewed the workbook. Here's what I see." And it is referencing to historicals, it is referencing to DCF tab. And this is the proposed assumptions. It's saying that growth rate was 65% for the last year. However, it is projecting lower growth rate as we asked, and this is very expected because the same company cannot have a very high growth rate every single year, so that's fine. Then we have operating assumptions. It is generating other assumptions that will be used as input parameters for calculating DCF. All of this looks good, so I will say, "Yes, go with it." We have a result.
3:24 You can see that under DCF, now we have an actual model. Here we can see both unlevered free cash flows, we can see evaluations, and we can see implied value per share. But what is very shocking is implied value per share. So, this means that this is the value for every single share of Nvidia. Now, if we come back to the fact that Nvidia is publicly traded company, it means that we can actually check what is the actual market value for Nvidia. And if we just write Nvidia stock price, we can see that it is 194 instead of the number that are based on fundamental analytics. So, this is the actual number that it's worth.
4:09 So, now we can ask a question. Is Nvidia stock overvalued or not? And let's actually send one prompt to Cloud, give it the actual number, and see what Cloud will do. So, I'm saying on the assumption tab at the blue input cell called current share price, and here we are giving the current share price. Let's wait until Cloud will do those updates. Okay, we have a result. Now Cloud actually added the current share price in here under assumption, and if we go back to DCF, here we can see applied value per share, terminal growth rows, we see VACC columns, and you can see that all of those are red, and we can also see that implied value per share is yellow.
4:55 And now, if you are a new financial analyst, maybe you will stay here. But if you are in the junior financial analyst, you have more questions, and you will ask more skeptical, and you will use this prompt that is saying assumption tab is too aggressive or unsupported. Pay special attention to terminal growth rate. It should not exceed long-run GDP growth. Change the terminal growth rate to 2.5, and tell me what it implies per share value. Here, if I go to assumptions, here we can see Let's try to find what is the growth rate. So, it is 3%. However, we are assuming that GDPR needs to be around 2.5%, which means that Cloud may be used for high growth rate, and that is why the numbers are not quite right.
5:47 So, this is something that you need to be aware of when you are using Cloud in Excel. It can do the math, but it might not know all the context information that a financial analyst will know. So, now let's try to send the Okay, we have a result in here. You can see that Cloud is explaining the numbers, and it also checked numbers. For example, here for terminal growth, it down created a number. Instead of 3% we have 2.5, and then it's explaining all the other numbers, and it applied also the numbers here in DCF model. Now, can Cloud in Excel replace a junior financial analyst? The answer is yes and no, because it did 90% of the job. It can take the historical numbers for Nvidia.
6:33 It can create the DCF model. It can create the assumptions and all the difficult formulas. However, it is still lacking the sense how sensitive different numbers should be. So, even if you can use Cloud as a financial analyst, you still need the experience and number sensitivity to understand and to apply some logic which numbers make sense and which numbers do not make sense. Now, if you want to get the prompts that I used during this video, just comment prompts and I will send those to you. And if you like this video and want more videos in this format, give me thumbs up and I will create more videos in the same format. Have a good day, and bye.
Want this working inside your finance team?

Ani Björkström — founder of QvantX Sweden AB, a Stockholm consultancy building AI solutions for banks, asset managers and finance teams. Anthropic partner. Every article starts from a real client build, minus the confidential parts. LinkedIn →
Keep reading — AI in Finance
 AI's Circular Financing, Explained — Scam or Not?
 I Tested Claude for Excel: It Fixed My Broken P&L Model
 3 Claude Agents Every Finance Analyst Should Steal (Full Prompts Included)
More: all 54 articles · Claude vs ChatGPT for finance · best AI tools for finance teams · work with QvantX